


geoelektrische Messungen in Impaktstrukturen
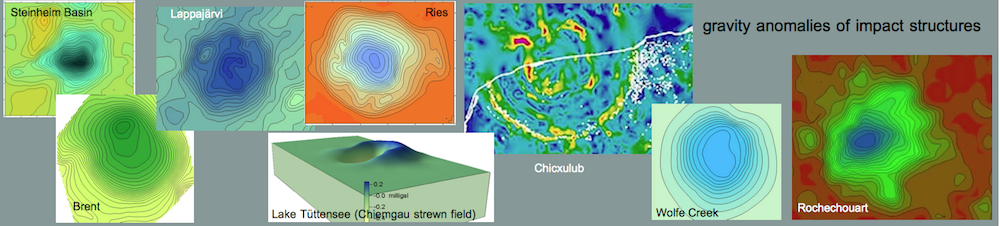
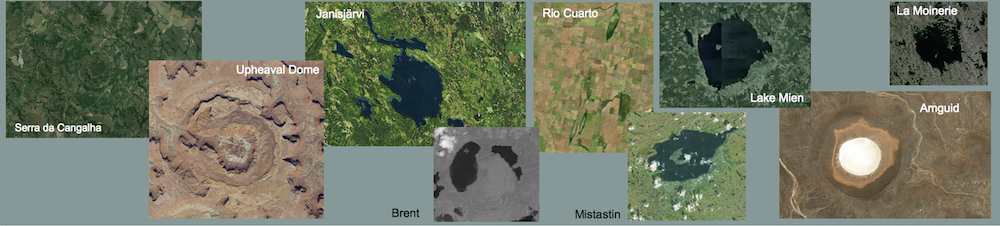
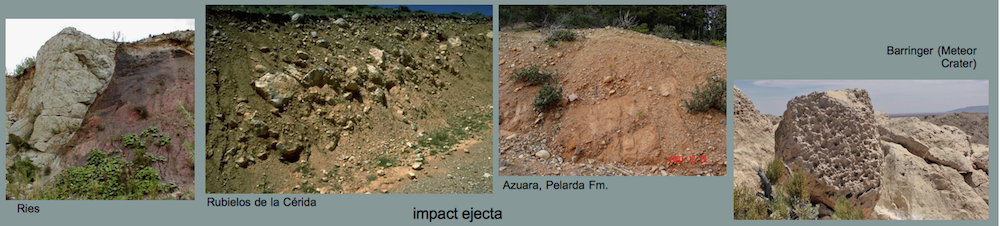
Like seismic velocities, magnetic properties and density of rocks, the underground geoelectric resistivity may change considerably in and after the impact cratering process. Fracturing of rocks with the formation of increased porosity, deposition of new rock units (impact melt rocks, suevites, monomictic and polymictic breccias) and post impact sedimentation in the crater basin may produce significant resistivity anomalies compared with resistivity sections outside the impact area. Thus resistivity measurements using DC, magnetotelluric and VLF soundings have contributed to investigate crater structures and impact rocks, although, compared with, e.g., gravity surveys, geoelectrics has so far not played the role of a standard method in the geophysical study of impact structures. Most common is the application of magnetotelluric (MT, AMT) soundings to the investigation of larger impact craters (e.g., Siljan (Sweden), Chesapeake (USA):http://pubs.usgs.gov/pp/2005/1688/ak/PP1688_chapJ.pdf , Araguainha (Brazil):http://www3.interscience.wiley.com/journal/119282506/abstract , Serra da Cangalha (Brazil): http://doc.rero.ch/lm.php?url=1000,43,4,20050905101653-LG/1_Schnegg_Pierre-Andr___-_An_integrated_magnetotelluric_20050905.pdf , Chicxulub (Mexico):http://www.geofisica.unam.mx/divulgacion/geofinternacional/iframes/anteriores/2001/04/delgado3.pdf ). Early extensive geoelectrical surveys using DC resistivity soundings and, later, magnetotellurics have been performed for the Ries (Germany) impact structure:
Ries (Germany) impact structure
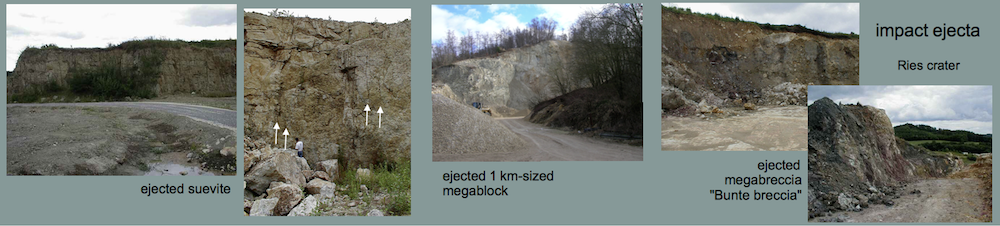
The Ries crater that has been formed in a mixed target of roughly 600 m Triassic and Jurassic sedimentary rocks over crystalline basement, is geoelectrically distinguished especially by up to 400 m thick Tertiary post-impact lake sediments and a several 100 m thick layer of suevite (Fig. 1). From modeling of resistivity DC soundings, measurements over exposed rocks, borehole geophysical measurements and measurements of drilled samples, a broad spectrum of rock resistivities was achieved. Lake sediment resistivities in general vary between about 3 and 15 Ohm*meters showing in part very strong resistivity anisotropy of drill cores. Suevites have relatively low resistivities as well between about 3 and 50 Ohm*meters. Thus, the Ries crater in a first approximation can as a whole be considered a large low-resistivity causative body embedded in the target rocks. However, internal structures like a central basin and inner rings also become apparent in the resistivity distribution. Peripherally and surficially, geoelectric DC soundings are not very promising because of extensive ejecta deposits of strongly varying composition and thickness.
 Fig. 1. A model of the Ries impact structure based on geophysical measurement and deep boreholes (for an enlarged picture see http://www.impact-structures.com/germany/ries.htm).
The measurements in the early seventies comprise about 300 depth soundings performed in Schlumberger and dipole – dipole (azimuthal) electrode configurations with maximum dipole spacing up to R = 2,000 m (Fig. 2). In the following, we show some typical results taken from Ernstson, K. (1974): The Structure of the Ries Crater from Geoelectric Depth Soundings. – J. Geophys., 40, 639 – 659.
 Fig. 2. Ries impact structure: characteristic DC resistivity sounding curve measured in the central basin. The first part of the curve has been measured in a Schlumberger, the second part in a two-sided azimuthal dipole – dipole configuration.
 Fig. 3. DC sounding curve from the Ries crater central basin and 7-layer resistivity model. An interpretation of a, b = lake sediments, c = suevite and d = fractured crystalline basement is ascribed to the model, although distinctly different models may apply. The minimum apparent resistivity (4 Ohm*m) at about AB/2 = 150 m is used for the construction of the isoohm map in Fig. 4.
 Fig. 4. Map of minimum apparent resistivities (isoohms; see Fig. 3) in the central basin of the Ries crater. Since the isoohm plot uses pure field data only it is independent of any modeling ambiguity.
 Fig. 5. Isoohm plot (slightly simplified from Fig. 4) over Bouguer gravity isogals (seeGravity surveys). The close correlation of geoelectrics and gravimetry is obviously based on the low resistivities of lake sediments and suevites that correspond with the low densities of these units.
 Fig. 6. Plot of diametric profiles of apparent resistivities and magnetic total intensity profiles across the Ries crater central basin. The apparent resistivity elements have been taken from two-sided dipole – dipole DC depth soundings (see Ernstson, 1974) and the magnetic data from an isanomalic map (Pohl and Angenheister, 1969). The correlation between geoelectrics and geomagnetics is interpreted by the varying thickness of the inversely magnetized suevite layer in the central basin (see Geomagnetic surveys).
 Fig. 7. Seismic, gravity, geomagnetic and geoelectric data on a radial profile across an uplifted structure in the central Ries crater basin that is interpreted as a 5 km-diameter innermost ring. Seismic and magnetic data after Angenheister and Pohl (1969). The geoelectric profile is part of the profile B in Fig. 6.
Ries crater magnetotellurics
A program of magnetotelluric soundings at 15 stations on two profiles across the Ries impact structure has been performed (Haak, V. et al. 1977): On the distribution of the electrical conductivity in the Ries area from magnetotelluric measurements. – Geologica Bavarica, 75, 395-400 [in German]) revealing a significant large-scale resistivity anomaly. In Fig. 8, a north – south profile of apparent resistivities for a 100 sec period is plotted with a decrease of about 2,000 Ohm*m outside the structure to roughly 40 Ohm*m in the center of the crater. At a 100 s period the magnetotelluric registrations reflect a kind of integrated resistivity over the upper few kilometers.
 Fig. 8. Apparent resistivities from magnetotelluric soundings on a profile across the Ries impact structure. The strong decrease of the apparent resistivities is primarily due to the high electrical conductivity of the lake sediments and suevite layers in the central basin of the impact structure that has previously been established by high-penetration geoelectric DC depth soundings (see above; e.g., Fig. 3, and below, Fig. 9).
 Fig. 9. Apparent resistivity profiles in the Ries crater area from induction (MT) and geometric (DC) soundings. The DC resistivity segments have been constructed from two-sided azimuthal dipole – dipole depth soundings for a dipole spacing of 1.6 km (see Ernstson 1974).